In the digital age, we’re swimming in a sea of statistical data. From e-commerce websites tracking our purchase history to fitness apps logging our daily steps, data is being generated at an astonishing rate. But if we can’t make sense of it, what use is all this information? That’s where the power of data visualization comes into play, helping us turn complex statistics into actionable insights.
Unleashing your Visual Imagination
Humans are naturally visual creatures. We’ve been telling stories through visuals for millennia, from cave paintings to intricate tapestries. In today’s data-driven world, we can harness this innate ability to process information through visuals. Data visualization takes raw numbers and transforms them into charts, graphs, maps, and interactive dashboards. It’s a language that speaks to our visual cortex, making it easier for us to comprehend complex data.

1. Complex Data, Simple Visualization
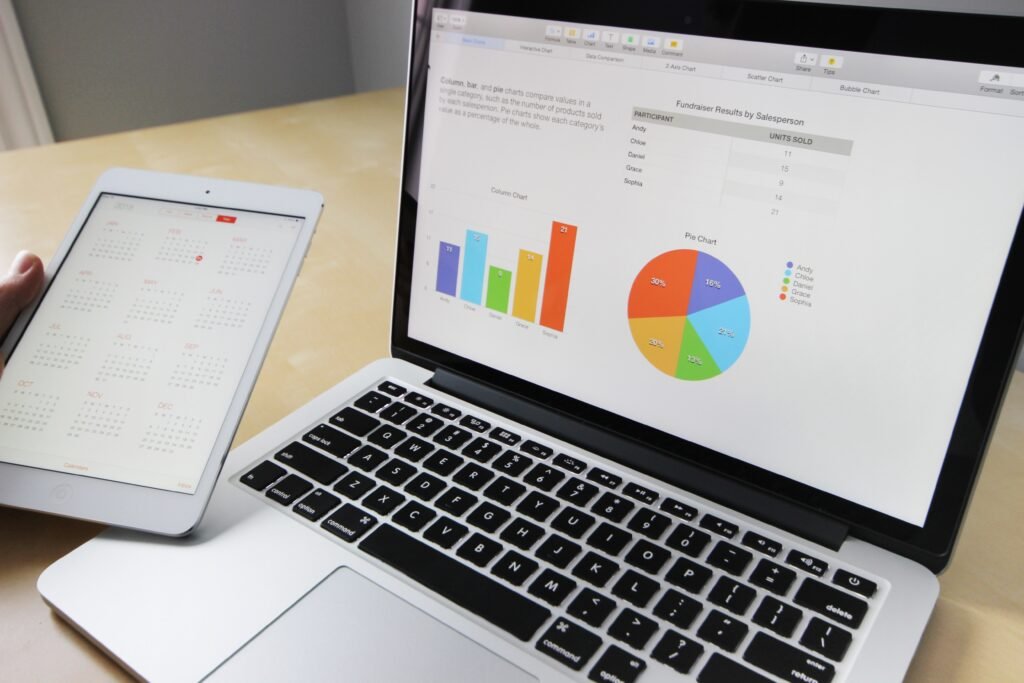
Think back to your last spreadsheet filled with rows and columns of numbers. Imagine the same information now shown as a vibrant bar chart. Which one is easier to understand? The chart, of course! Data visualization simplifies complexity. It turns data points into shapes, colors, and patterns that our brains can quickly process. What might have taken hours of pouring over spreadsheets can now be grasped in seconds simplifying the decision-making process of Digital Marketing.

2. Spotting Trends and Anomalies
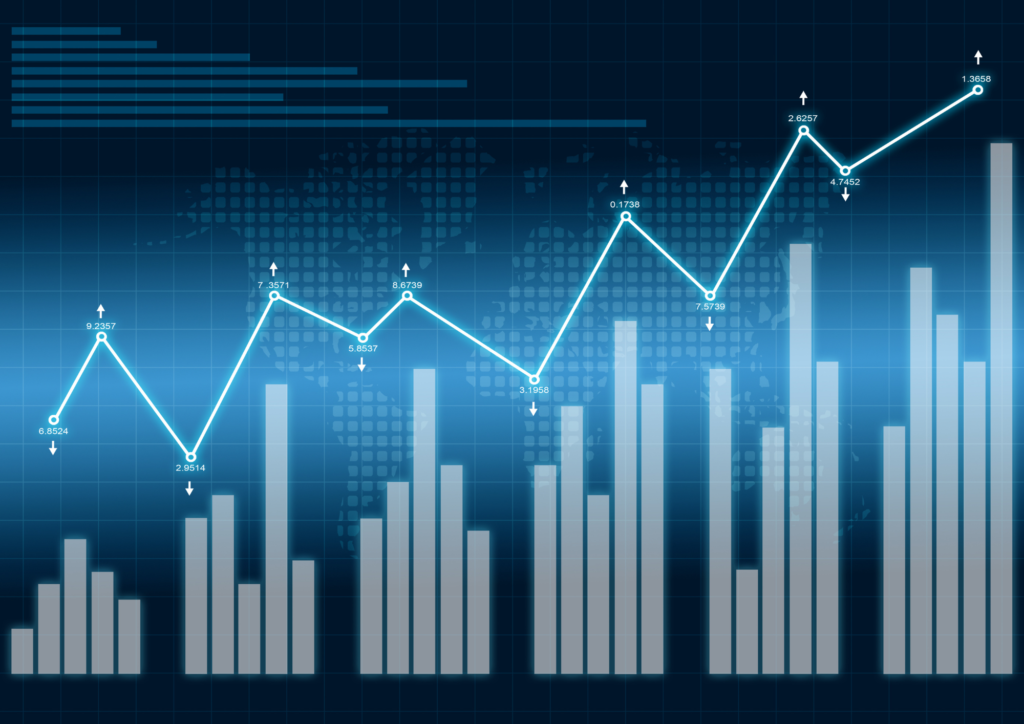
Data visualization is like a magnifying glass for your data. It helps you spot trends, outliers, and correlations that might have otherwise gone unnoticed. Take, for instance, a line chart tracking monthly website traffic. By simply glancing at the chart, you can see if there are seasonal patterns, spikes in traffic, or gradual declines. This insight can guide your content strategy or advertising efforts making audience targeting and segmentation much easier.

3. Enhancing Decision-Making
In the corporate world, data-driven decision-making is the norm. Leaders use data visualizations to make informed choices about everything from marketing campaigns to product development and even search optimization. Instead of relying on gut feelings, they turn to charts and graphs to guide their strategies. This not only reduces the risk of making costly mistakes but also maximizes the chances of success.

4. Bridging the Gap
Data scientists and analysts are not the only people who can use data visualization. It’s a powerful tool for bridging the gap between experts and non-experts. A well-crafted visualization can convey complex information to a broad audience. Whether you’re explaining climate change to the public or presenting financial data to shareholders, data visualization can break down barriers and foster understanding.

5. Tools of the Trade
To harness the power of data visualization, you don’t need to be a coding wizard. There is a plethora of user-friendly tools available, such as Tableau, Power BI, and even Excel, that allow you to create compelling visuals without a deep technical background. With a bit of practice, you can start turning your own data into insightful visuals.

Conclusion
Data visualization is not just about creating pretty pictures; it’s about transforming statistics into insights that drive action. In a world drowning in data, the ability to distil complex information into simple, visual representations is a superpower. So, whether you’re a business leader, a researcher, or simply someone curious about the world, embrace the power of data visualization. It’s a gateway to understanding, discovery, and better decision-making in our data-driven age.

